自定义性能监视器
前言
如 调试器面板 文档所述,Godot 中的 调试器 > 监视 底部面板可以跟踪显示各种值,用图表展示这些值随时间的变化。这些图的数据来源于引擎的 Performance 单例。
从 Godot 4.0 开始,你可以声明要在“监视”选项卡中显示的自定义值。自定义性能监视器的示例用例包括:
Displaying performance metrics that are specific to your project. For instance, in a voxel game, you could create a performance monitor to track the number of chunks that are loaded every second.
Displaying in-game metrics that are not strictly related to performance, but are still useful to graph for debugging purposes. For instance, you could track the number of enemies present in the game to make sure your spawning mechanic works as intended.
创建自定义性能监视器
在这个例子中,我们将创建一个自定义性能监视器来跟踪当前运行的项目中存在多少敌人。
主场景中有一个 Timer 节点,附加了以下脚本:
extends Timer


func _ready():
    # The slash delimiter is used to determine the category of the monitor.
    # If there is no slash in the monitor name, a generic "Custom" category
    # will be used instead.
    Performance.add_custom_monitor("game/enemies", get_enemy_count)
    timeout.connect(_on_timeout)
    # Spawn 20 enemies per second.
    wait_time = 0.05
    start()


func _on_timeout():
    var enemy = preload("res://enemy.tscn").instantiate()
    get_parent().add_child(enemy)


# This function is called every time the performance monitor is queried
# (this occurs once per second in the editor, more if called manually).
# The function must return a number greater than or equal to 0 (int or float).
func get_enemy_count():
    return get_tree().get_nodes_in_group("enemies").size()
Performance.add_custom_monitor 方法的第二个参数是一个 Callable。
``enemy.tscn``是一个根节点为 Node2D、带有 Timer 子节点的场景。Node2D 附加了以下脚本:
extends Node2D


func _ready():
    add_to_group("enemies")
    $Timer.timeout.connect(_on_timer_timeout)
    # Despawn enemies 2.5 seconds after they spawn.
    $Timer.wait_time = 2.5
    $Timer.start()


func _on_timer_timeout():
    queue_free()
在这个例子中,由于我们每秒生成20个敌人,每个敌人在生成后2.5秒就会死亡,我们预计场景中存在的敌人数量将稳定在50个。我们可以通过查看图表来确定这一点。
To visualize the graph created from this custom performance monitor, run the project, switch to the editor while the project is running and open Debugger > Monitors at the bottom of the editor window. Scroll down to the newly available Game section and check Enemies. You should see a graph appearing as follows:
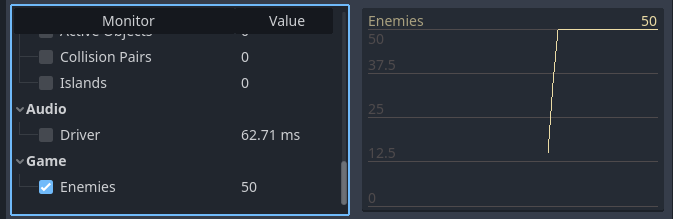
自定义性能监视器的编辑器图表示例
备注
性能监视器处理代码不必与节点本身位于同一脚本中。你可以选择将性能监视器的注册和 getter 函数移动到自动加载中。
在项目中查询性能监视器
如果你想在运行中的项目窗口(而不是编辑器窗口)中显示性能监视器的值,可以使用 Performance.get_custom_monitor("分类/名称") 来获取自定义监视器的值,这个值可以放在 Label、RichTextLabel、2D 中的自定义绘图、3D 文本 中显示。
此方法也可用于导出项目(调试和发布模式),你可以在编辑器外创建可视化内容。