调试器面板
在屏幕下方的调试器面板中, 可以找到包括调试器在内的许多Godot的调试工具. 点击 调试器 即可打开.
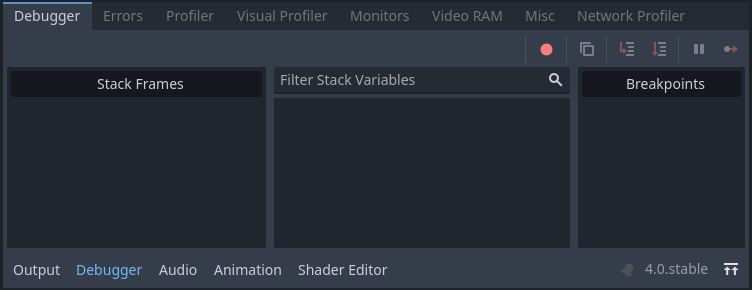
调试器面板被分成几个标签, 每个标签专注于一个特定的任务.
Stack Trace
The Stack Trace tab opens automatically when the GDScript compiler reaches a breakpoint in your code.
It gives you a stack trace, information about the state of the object, and buttons to control the program's execution. When the debugger breaks on a breakpoint, a green triangle arrow is visible in the script editor's gutter. This arrow indicates the line of code the debugger broke on.
小技巧
You can create a breakpoint by clicking the gutter in the left of the script editor (on the left of the line numbers). When hovering this gutter, you will see a transparent red dot appearing, which turns into an opaque red dot after the breakpoint is placed by clicking. Click the red dot again to remove the breakpoint. Breakpoints created this way persist across editor restarts, even if the script wasn't saved when exiting the editor.
You can also use the breakpoint keyword in GDScript to create a
breakpoint that is stored in the script itself. Unlike breakpoints created by
clicking in the gutter, this keyword-based breakpoint is persistent across
different machines when using version control.
你可以使用右上角的按钮来:
跳过所有断点. 这样一来, 你就可以为将来的调试会话保存断点.
复制当前错误消息.
步入 代码. 这个按钮将带你进入下一行代码, 如果是函数, 它将逐行进入函数.
步过 的代码. 这个按钮会进入下一行代码, 但它不会逐行跳过函数.
Break . 这个按钮会暂停执行游戏.
继续 . 该按钮在断点或暂停后恢复游戏.
错误
这是运行游戏时打印错误和警告信息的地方.
你可以在 项目设置>调试> GDScript 中禁用特定的警告.
Evaluator
This tab contains an expression evaluator, also known as a REPL. This is a more powerful complement to the Stack Variables tree available in the Stack Trace tab.
When the project is interrupted in the debugger (due to a breakpoint or script error), you can enter an expression in the text field at the top. If the project is running, the expression field won't be editable, so you will need to set a breakpoint first. Expressions can be persisted across runs by unchecking Clear on Run, although they will be lost when the editor quits.
Expressions are evaluated using Godot's expression language, which allows you to perform arithmetic and call some functions within the expression. Expressions can refer to member variables, or local variables within the same scope as the line the breakpoint is on. You can also enter constant values, which makes it usable as a built-in calculator.
Consider the following script:
var counter = 0

func _process(delta):
    counter += 1
    if counter == 5:
        var text = "Some text"
        breakpoint
    elif counter >= 6:
        var other_text = "Some other text"
        breakpoint
If the debugger breaks on the first line containing breakpoint, the following
expressions return non-null values:
Constant expression:
2 * PI + 5Member variable:
counter,counter ** 2,sqrt(counter)Local variable or function parameter:
delta,text,text.to_upper()
If the debugger breaks on the second line containing breakpoint, the following
expressions return non-null values:
Constant expression:
2 * PI + 5Member variable:
counter,counter ** 2,sqrt(counter)Local variable or function parameter:
delta,other_text,other_text.to_upper()
分析器
分析器用于查看项目使用时正在运行的代码,以及这对性能的影响。
参见
关于如何使用分析器的详细说明可以在专用的 性能分析器 页面中找到。
可视分析器
可视分析器可以用来监视渲染一帧在 CPU 和 GPU 上分别在哪些项目上消耗的时间最多。这样就能够跟踪渲染时可能造成 CPU 和 GPU 方面瓶颈的原因。
警告
可视分析器只会测量 CPU 在渲染任务上所消耗的时间,例如绘制调用的执行。可视分析器中并不包含其他任务所消耗的 CPU 时间,例如脚本和物理。跟踪非渲染方面的 CPU 任务请使用“分析器”选项卡。
要使用可视分析器,请在运行项目后切换到“调试器”底部面板中的可视分析器选项卡,然后点击开始:
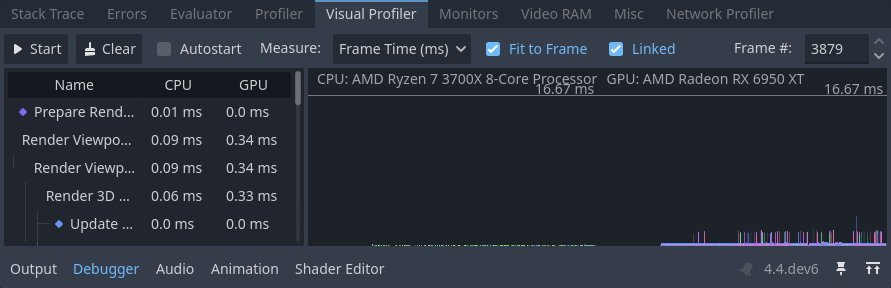
可视分析器选项卡,点击开始、等待几秒、然后点击停止
小技巧
You can also check Autostart, which will make the visual profiler automatically start when the project is run the next time. Note that the Autostart checkbox's state is not preserved across editor sessions.
You will see categories and results appearing as the profiler is running. Graph lines also appear, with the left side being a CPU framegraph and the right side being a GPU framegraph.
单击停止完成分析,此时结果仍然可见,但会冻结在原位。停止正在运行的项目后结果仍然可见,但退出编辑器后则不可见。
Click on result categories on the left to highlight them in the CPU and GPU graphs on the right. You can also click on the graph to move the cursor to a specific frame number and highlight the selected data type in the result categories on the left.
You can switch the result display between a time value (in milliseconds per frame) or a percentage of the target frametime (which is currently hardcoded to 16.67 milliseconds, or 60 FPS).
如果在分析过程中出现帧率峰值,就可能会导致图表尺度的问题。禁用适应帧可以让图表放大至 60 FPS+ 的部分。
备注
请记住,可视分析器的结果可能会因视口分辨率的不同而有很大差异,如果 拉伸模式 使用 disabled 或 canvas_items,则视口分辨率由窗口大小决定。
对比两次运行之间的结果时,请确保每次运行所使用的视口大小相同。
使用任何渲染方法(Forward+、Mobile、Compatibility)时都支持可视分析器,但报告的类别将根据当前渲染方法以及启用的图形功能而有所不同。例如使用 Forward+ 时,具有阴影投射灯光的简单 2D 场景将显示以下类别:
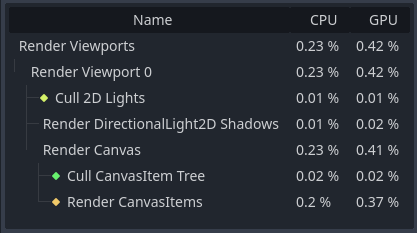
2D 场景在可视分析器中的示例结果
再举一个 Forward+ 的例子,启用了阴影投射灯光和各种效果的 3D 场景将导致启用以下类别:
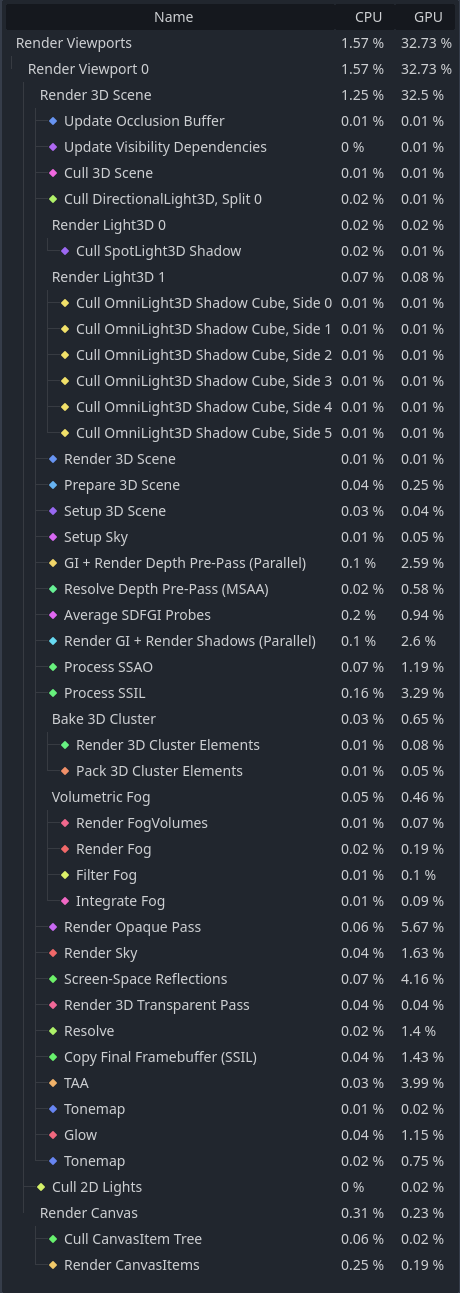
3D 场景在可视分析器中的示例结果
Notice how in the 3D example, several of the categories have (Parallel) appended to their name. This hints that multiple tasks are being performed in parallel on the GPU. This generally means that disabling only one of the features involved won't improve performance as much as anticipated, as the other task still needs to be performed sequentially.
备注
The Visual Profiler is not supported when using the Compatibility renderer on macOS, due to platform limitations.
网络分析器
网络剖析器包含了所有通过多人游戏API进行通信的节点列表, 对于每个节点, 还包含了一些传入和传出网络交互量的计数器. 它还具有一个带宽表, 可以显示任何特定时刻的总带宽使用情况.
备注
带宽计量器不会考虑 高级多人游戏 API 自己的压缩系统。这意味着改变所使用的压缩算法不会改变带宽计量报告的数值。
监视
监视器是游戏运行时几个方面的图表, 如FPS, 内存使用情况, 场景中的节点数量等等. 所有的监控器都会自动跟踪统计, 所以即使游戏运行时一个监控器没有打开, 你也可以在以后打开它, 查看数值的变化.
参见
除了默认的性能监视器外,您还可以创建 自定义性能监视器 来跟踪项目中的任意值。
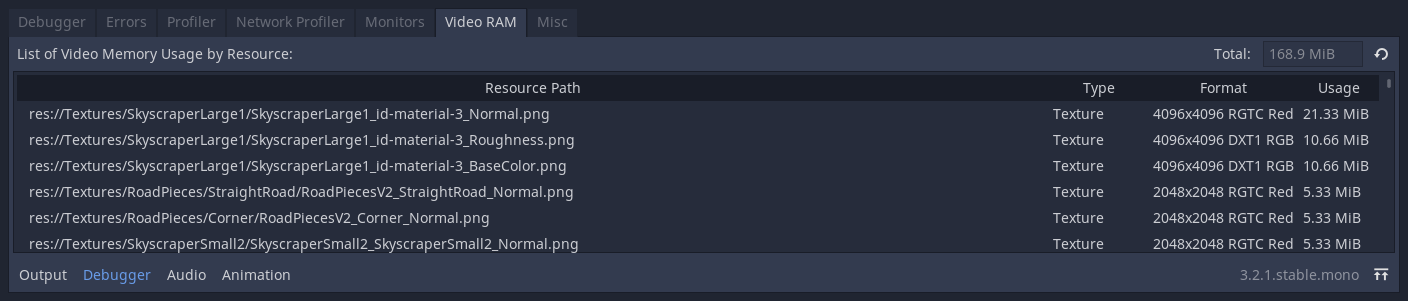
显存
显存标签显示了游戏运行时的显存使用情况。它按资源路径提供了每一个使用显存的资源列表、资源的类型、资源的格式,以及该资源使用了多少显存。在面板的右上方还有一个显存占用总量的数字。
其他
其他选项卡中的工具可以用来识别你在运行时点击了哪个控件节点:
点击的控件显示的是被点击节点在场景树中的位置。
点击的控件类型显示的是被点击节点的类型。