性能分析器
You run your game from Godot and play around. It's fun, it's becoming feature complete, and you feel it's getting close to release.
但是,当你打开技能树时,它会因为代码中的问题而停止运行。看着技能树像幻灯片一样滚动是不可接受的。出了什么问题?是定位技能树元素、UI还是渲染?
你可以尝试优化一切,反复运行游戏,但你可以更聪明地处理这件事,缩小可能性。进入Godot的分析器。
性能分析器概述
打开调试器面板并点击分析器选项卡即可打开性能分析器。
Godot 的性能分析器并不会自动运行,因为性能分析也有很大的性能开销。性能分析会持续不断地观测游戏中发生的所有事情并将其汇报给调试器,因此默认是关闭的。
To begin profiling, run your game then focus back on the editor. Click on the Start button in the top-left corner of the Profiler tab. You can also check Autostart, which will make the profiler automatically start when the project is run the next time. Note that the Autostart checkbox's state is not preserved across editor sessions.
备注
性能分析器目前不支持 C# 脚本。对 C# 脚本进行性能分析可以使用 JetBrains Rider 和 JetBrains dotTrace,安装 Godot 支持插件即可。
你随时都可以点击清除按钮清空数据。测量数据的类型可以通过测量下来菜单修改。测量面板和图表会相应地发生变化。
测量数据
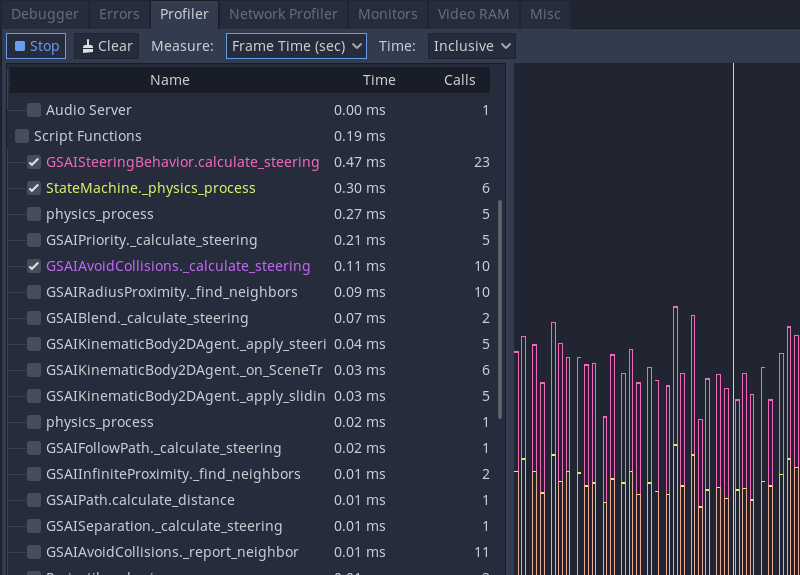
分析器的界面分为两个部分。左侧是功能列表,右侧是性能图表。
主要的测量内容有帧时间、物理帧、空闲时间、物理时间。
帧时间指的是 Godot 为完整的一幅图像执行的逻辑所消耗的时间,包括物理和渲染。
物理帧指的是 Godot 在物理更新之间所花费的时间。理想状态下,帧时间是你所选择的值:默认为 16.66 毫秒,对应 60 FPS。你可以用它作为其他相关信息的参考值。
空闲时间指的是 Godot 更新物理之外的逻辑所花费的时间,比如 _process 里的代码和设置为在 Idle 时更新的计时器和相机。
物理时间指的是 Godot 更新物理任务所花费的时间,比如 _physics_process 和设置为在 Physics 时更新的内置节点。
备注
帧时间包含渲染时间。如果你发现游戏里突然出现了迷之卡顿,而物理和脚本的运行速度都还挺快的,那么这种卡顿就可能是出现粒子特效或视觉特效造成的!
By default, Godot ticks on Frame Time and Physics Time. This gives you an overview of how long each frame takes relative to the allocated desired physics FPS. You can toggle functions on and off by clicking the checkboxes on the left. Other facilities make appearances as you go down the list, like Physics 2D, Physics, and Audio, before reaching Script functions, where your code appears.
If you click on the graph, you change which frame's information appears on the left. In the top right, there is also a frame counter where you can manually adjust the frame you are looking at more granularly.
测量范围和测量窗口
You can change what measurement you are looking at using the Measure drop-down menu. By default, it starts with Frame Time and lists the time it takes to go through the frame in milliseconds. The average time is the average time any given function took when called more than once. For example, a function that took 0.05 milliseconds to run five times should give you an average of 0.01 milliseconds.
If accurate milliseconds count is not important, and you want to see proportions of time relative to the rest of the frame, use percentage measurements. Frame % is relative to Frame Time, and Physics % is relative to Physics Time.
The last option is the scope of the time. Inclusive measures the time a function took with any nested function calls. For example:
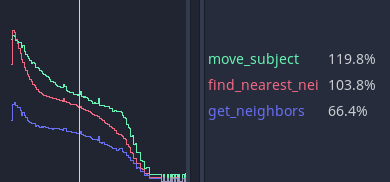
get_neighbors, find_nearest_neighbor and move_subject all took a lot of time. You could be fooled into thinking that this is because all three of them are slow.
But when changed to Self, Godot measures the time spent in the function body without considering function calls it made itself.
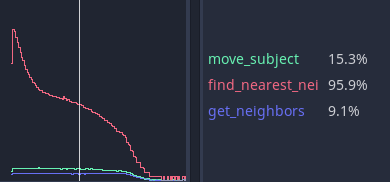
You can see that get_neighbors and move_subject have lost a lot of their importance. In effect, that means that get_neighbors and move_subject have spent more time waiting for some other function call to finish than not, and find_nearest_neighbor is actually slow.
使用分析器调试速度慢的代码
Finding slow code with the profiler boils down to running your game and watching the performance graph as it draws. When an unacceptable spike occurs in the frame time, you can click on the graph to pause your game and narrow the _Frame #_ to the spike's start. You may need to jump back and forth between frames and functions to find the root cause.
Under the Script functions, turn on the checkboxes for some functions to find which take time. These are the functions you need to review and optimize.
以微秒为单位手动测量
如果函数比较复杂,那么找出需要优化的部分可能会很困难。是数学的问题,还是获取进行数学运算所需数据的方式的问题?是 for 循环吗?还是 if 语句?
你可以让程序运行一些临时函数,手动计算时刻,来缩小测量范围。有两个属于 Time 类对象的函数,分别是 get_ticks_msec 和 get_ticks_usec 。第一个会以毫秒为单位(每秒为1,000毫秒)测量,而第二个则以微秒为单位(每秒为1,000,000微秒)测量。
两者都会以各自的时间量返回游戏引擎启动以来经过的时间。
如果使用微秒的开始和结束包裹一段代码,那两者的差则是运行这段代码花费的时间。
# Measuring the time it takes for worker_function() to run
var start = Time.get_ticks_usec()
worker_function()
var end = Time.get_ticks_usec()
var worker_time = (end-start)/1000000.0

# Measuring the time spent running a calculation over each element of an array
start = Time.get_ticks_usec()
for calc in calculations:
    result = pow(2, calc.power) * calc.product
end = Time.get_ticks_usec()
var loop_time = (end-start)/1000000.0

print("Worker time: %s\nLoop time: %s" % [worker_time, loop_time])
As you become a more experienced programmer, this technique becomes less necessary. You begin to learn what parts of a running program are slow. Knowing that loops and branches can be slow comes from experience, and you gain experience by measuring and doing research.
But between the profiler and the ticks functions, you should have enough to get started finding which parts of your code need optimization.